Data Visual
Issue 37:1| March 2017
Guest editor: Ian Milliss
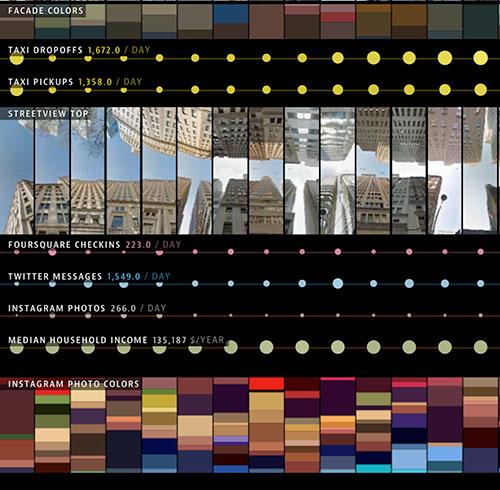
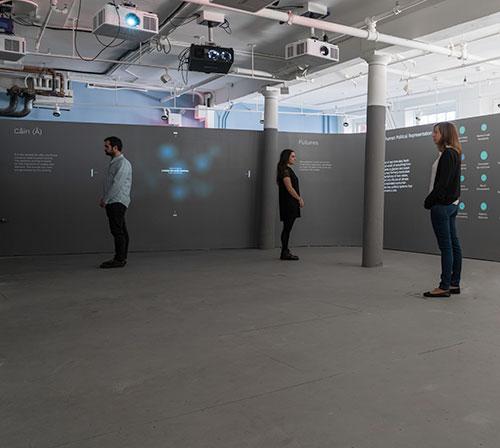
Data visualisation is the portrait or topographical landscape of our time. As big data has grown, data visualisation has developed as a way for us to understand, navigate and interact with structures of knowledge that are, for the most part, invisible, managed by equally invisible algorithms. This edition profiles work by artists and data specialists who use data as part of their practice, for diverse educational, exhibition and presentation outcomes in physical, virtual and screen spaces.
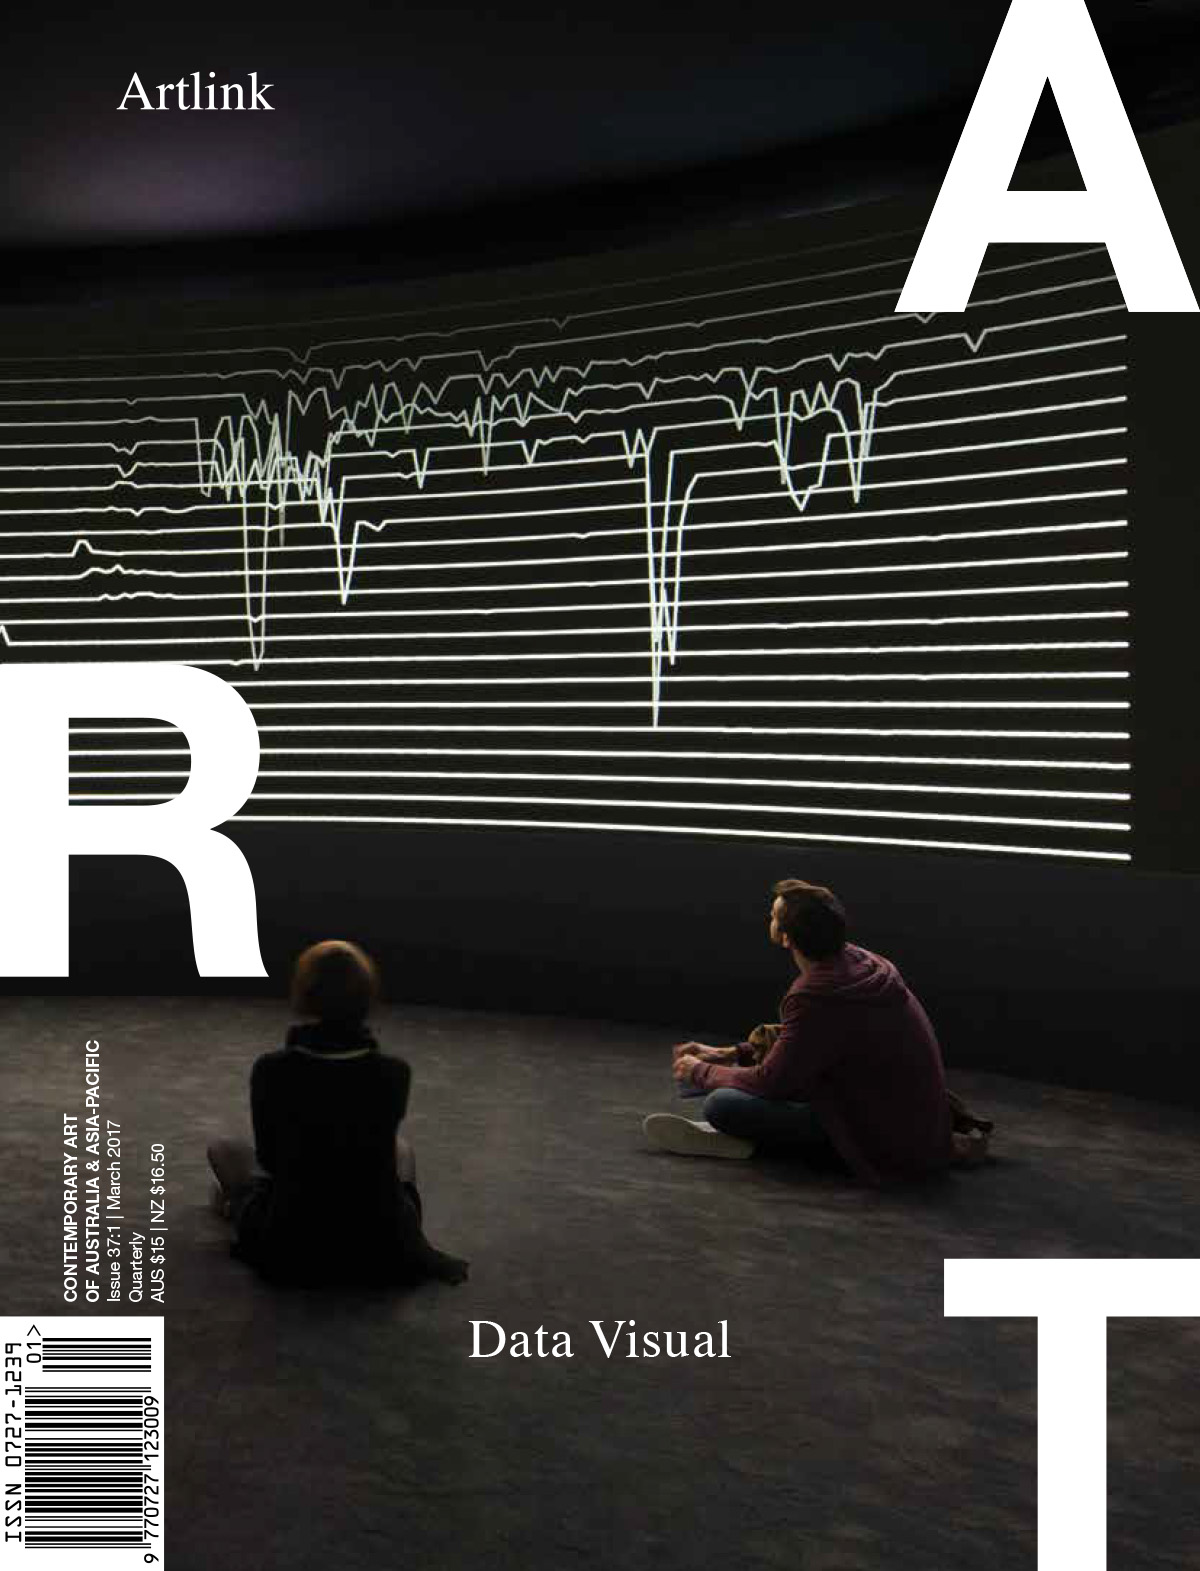
Cover image: EXIT 2008–2015, Diller Scofidio + Renfro, Mark Hansen, Laura Kurgan and Ben Rubin in collaboration with Robert Gerard Pietrusko and Stewart Smith. From an idea by Paul Virilio. Collection Fondation Cartier pour l’art contemporain, Paris.Photo; Luc Boegly
In this issue
Related issues

After AI
Issue 43:2 | Wirltuti / Spring 2023

Virtual Reality: Ways of Seeing
Issue 38:4 | December 2018
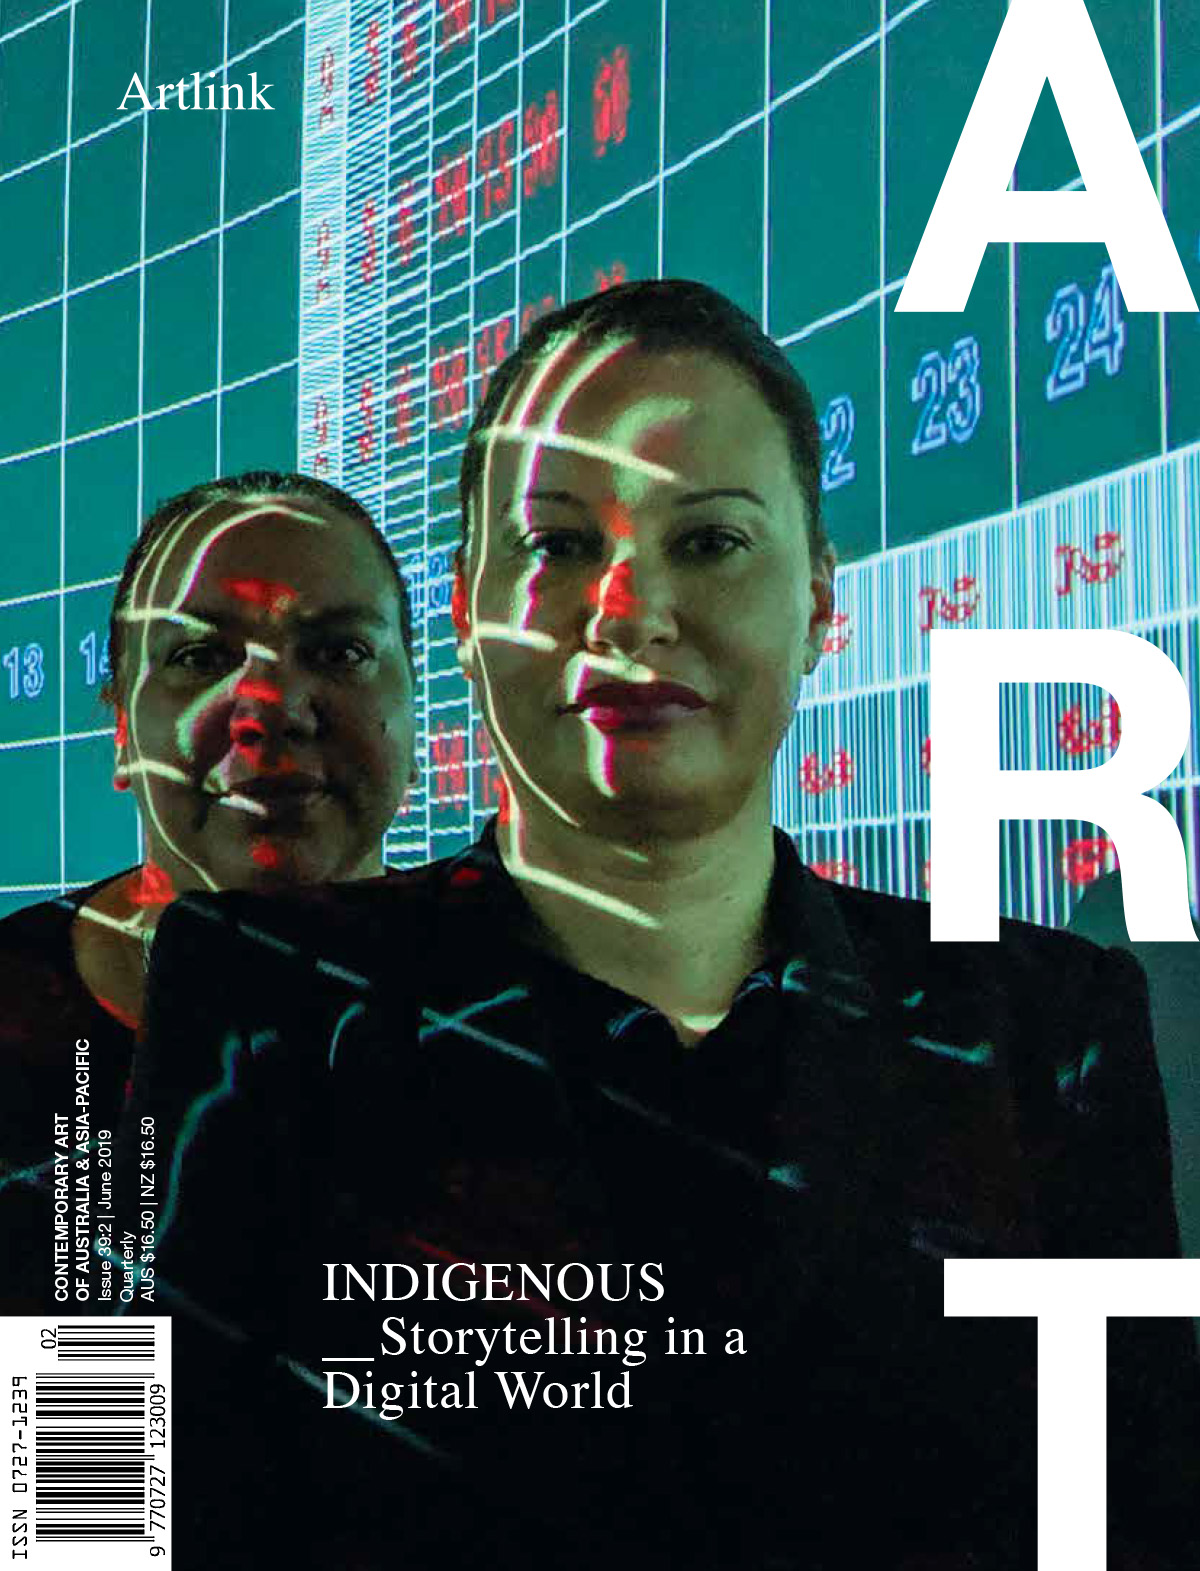
Indigenous: Storytelling in a Digital World
Issue 39:2 | June 2019

Art & Technology
Issue 7:2&3 | June 1987

